StatSoft PS Product Stability is a software designed for determination of the shelf-life of a medicinal product in accordance with ICHQ1E recommendations based on long-term stability study and on accelerated data, in addition, it can be used to trend the results collected during ongoing stability program.

The application allows:
- evaluation of long-term, accelerated and ongoing stability data,
- selection of an appropriate statistical method for the evaluation of product stability studies
- standardization of the statistical analyses performed and interpretation of the results
- generation of a complete report for submission of registration documentation
All you need is to enter the data and press a button to get a complete report in the form of a Microsoft Word or PDF document. The report includes results of the statistical analyses and comments to facilitate the interpretation of the obtained results. Optionally, the data can be stored in a dedicated database.
The software is validated according to cGxP requirements.
Main functionalities:
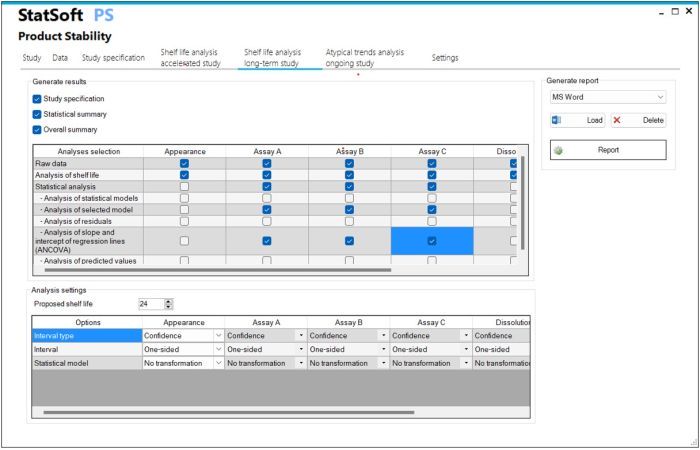
- Longterm stability study
- Determination of shelf-life based on confidence interval and/or prediction interval
- Determination of shelf-life based on one-sided or two-sided interval
- Selection of a linear statistical model with and without data transformation
- Evaluation of goodness of fit for all available statistical models
- Analysis of statistical significance of the selected model using t-test and F-test
- Analysis of validity of the selected model using residuals analysis
- Analysis of multiple batches with assessment of data poolability using ANCOVA
- Analysis of predicted values for the selected time interval
- Overall summary of the analysis for all tested batches/parameters
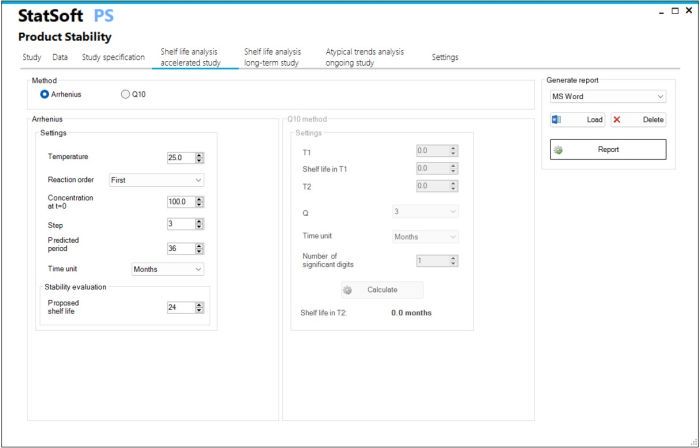
- Accelerated stability study
- Estimating shelf life based on the Arrhenius model
- Estimating shelf life based on the Q10 method
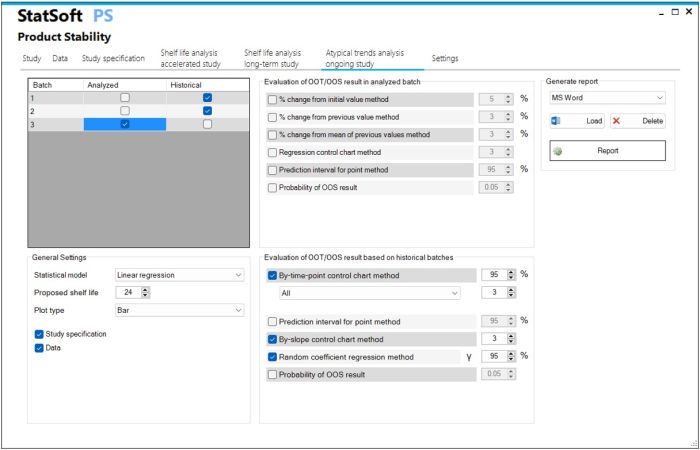
- Ongoing stability study
- Analysis of the out-of-trend OOT result in relation to historical series using
By time point control chart
By time point prediction interval
By slope control chart
Random coefficient regression
Evaluation of the probability of the OOS result - Analysis of the out-of-trend OOT result in relation to previous time points using
%change from initial, previous and average value
Regression control chart
Prediction interval for point
Evaluation of the probability of the OOS result
- Analysis of the out-of-trend OOT result in relation to historical series using
- Generation of reports in Word, e-CTD, PDF, Statistica formats
- Configuration of report content with selection of statistical analysis methods
- Creation of templates, containing the configured range of statistical analyses
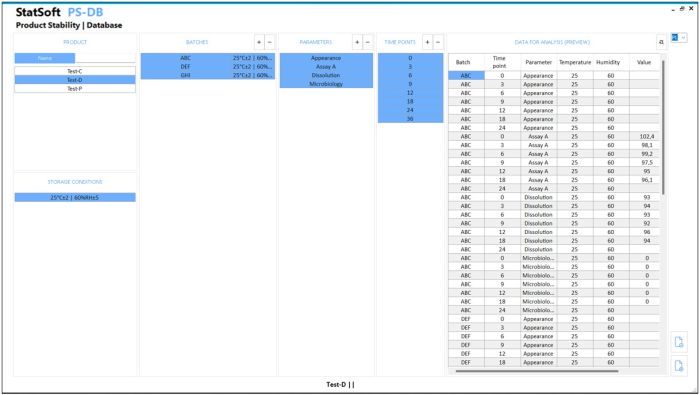
- Option: saving the results to a database with audit trail
Learn more! Watch our webinars for free:
Monitoring and evaluation of the product in stability studies